

The Shore Stations Program collects and provides access to current and historical sea surface temperature (SST) and salinity (SSS) measurements observed at shoreline stations along the west coast of the United States. Historically, stations ranged from the southern most station in La Jolla, California, up to the northern most point on the western coast, Neah Bay, Washington, which sits at the entrance of the Straits of Juan de Fuca. Currently, all active stations are located in California.
Click on a station below to view and access the data:
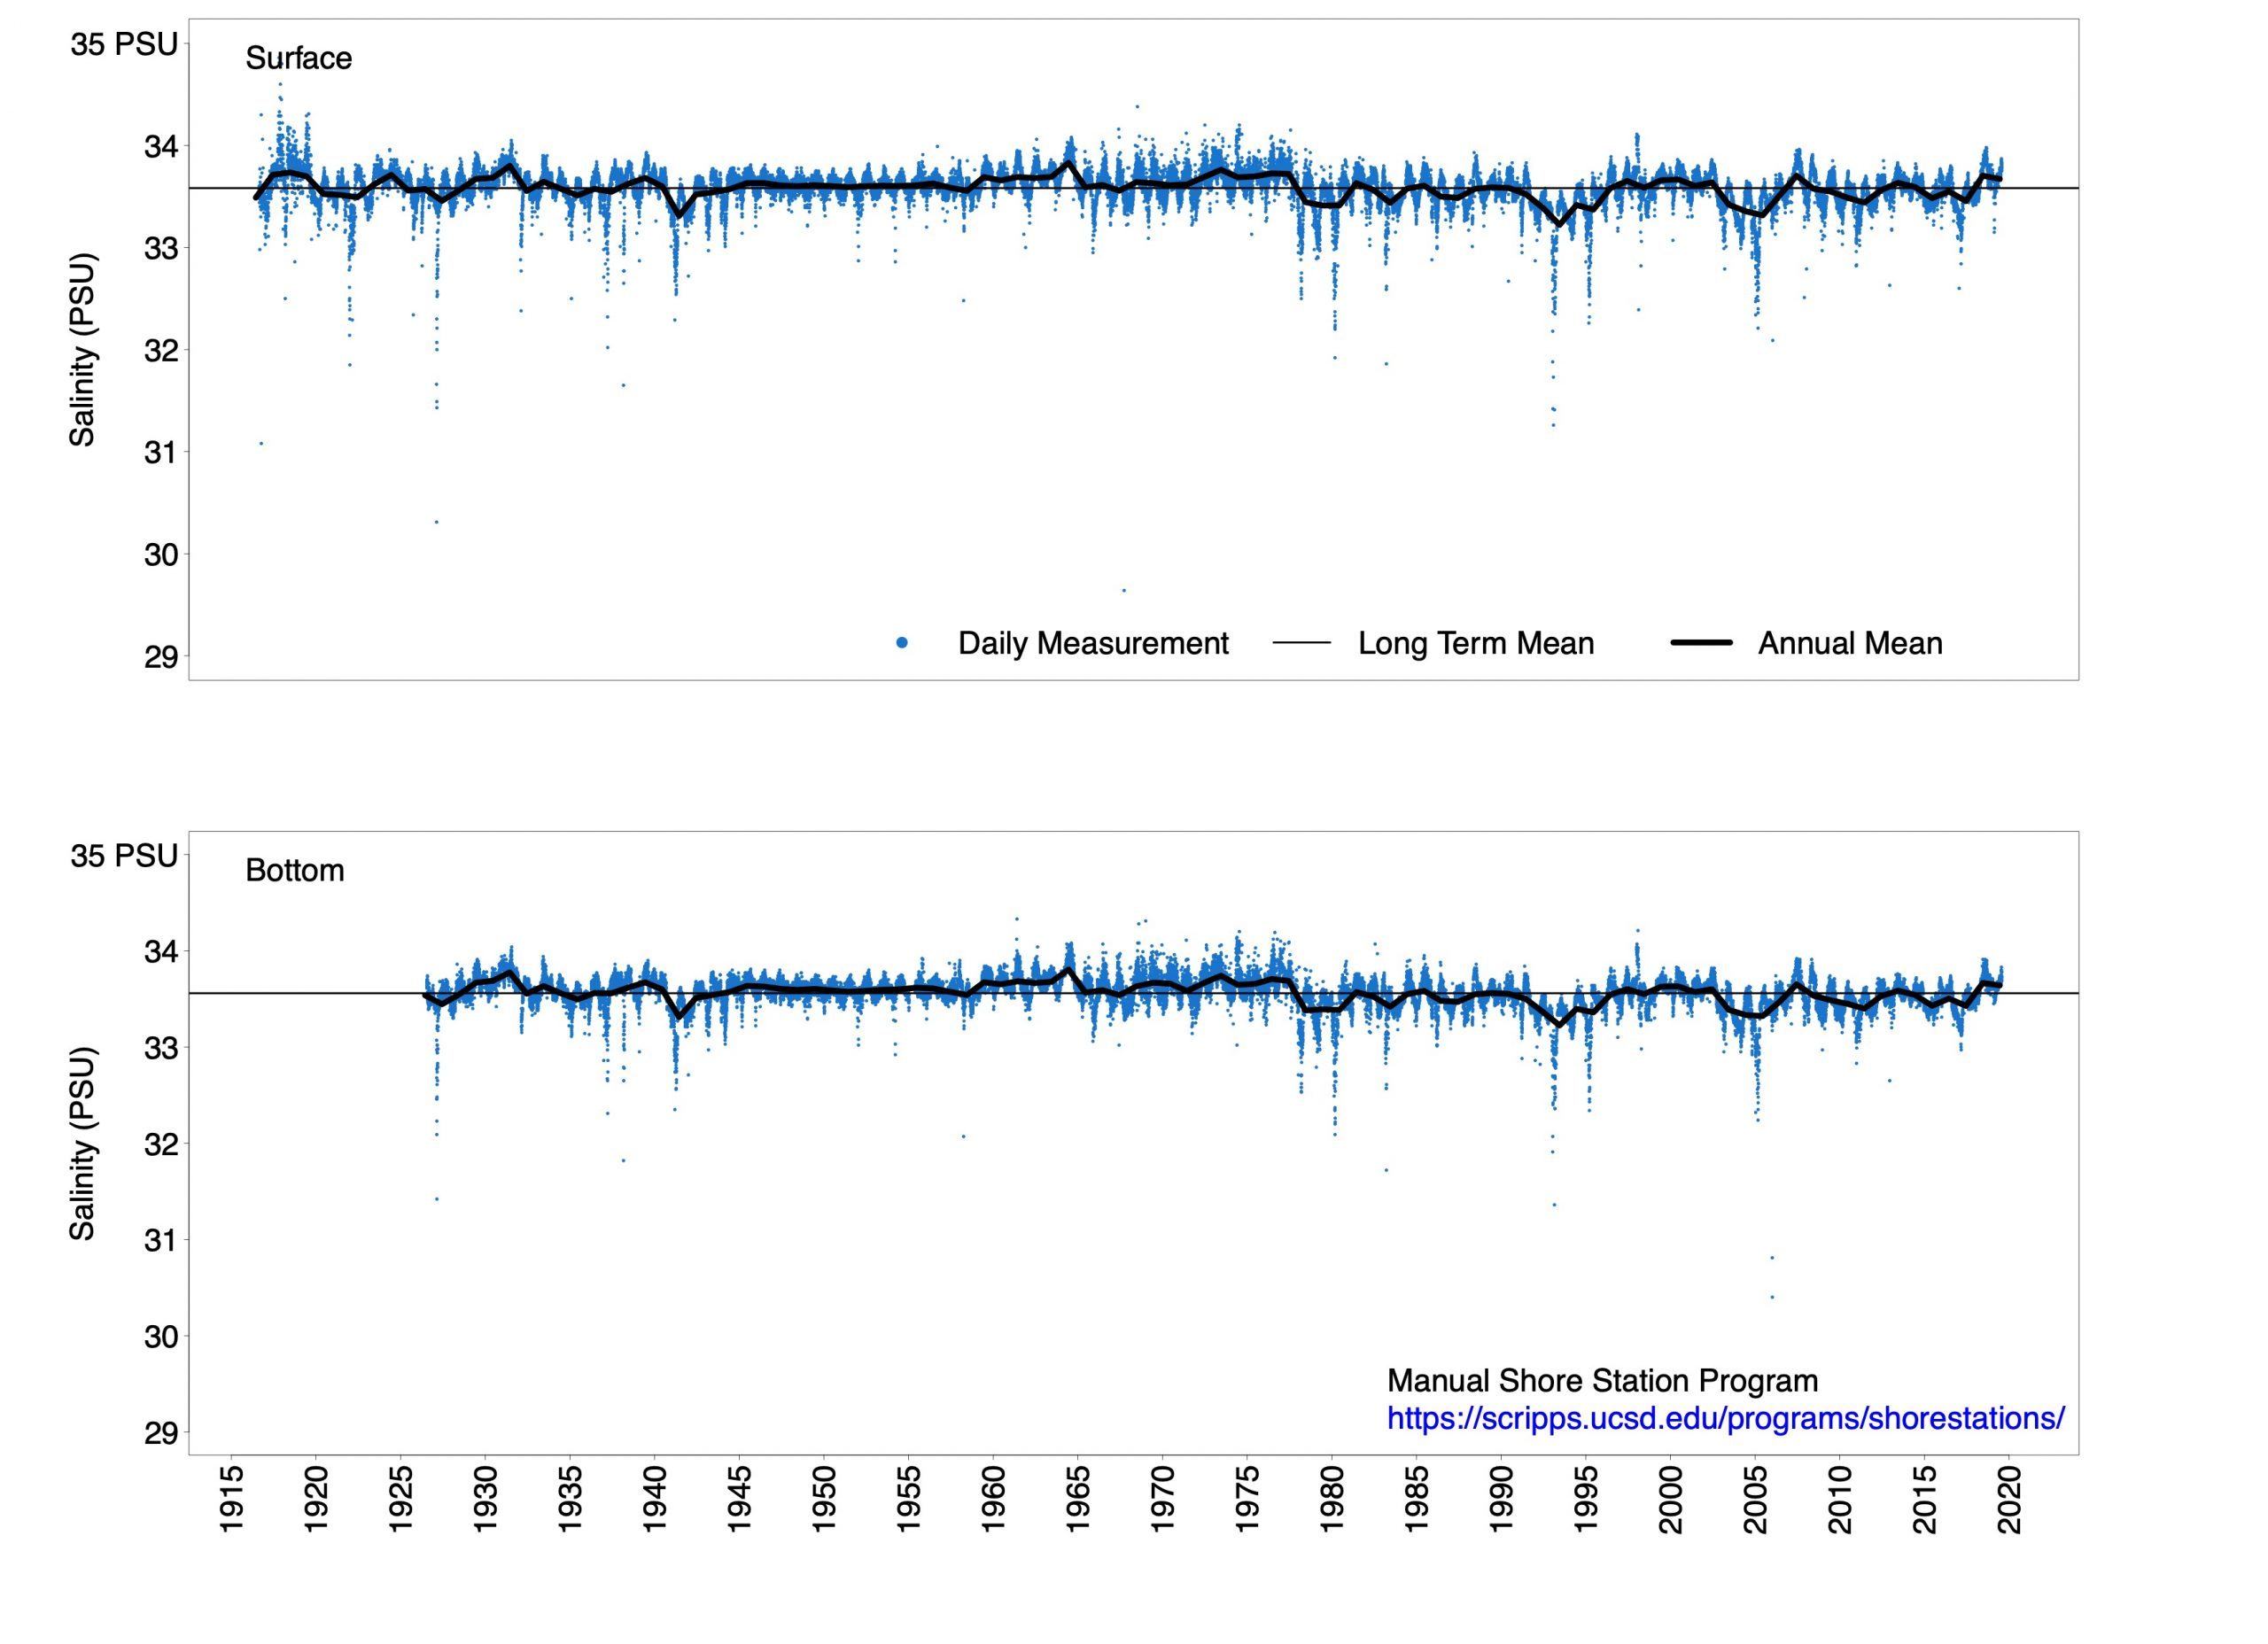
Over 100 Years of Daily Temperature and Salinity Measurements at Scripps Pier in La Jolla, CA
In 2016 the Shore Stations Program celebrated 100 years of collecting and publishing data. These measurements began in 1916 after the construction of the first pier at Scripps Institution of Oceanography was finished. Recently, the Scripps Pier time series received national scientific and media attention when century-long record highs were broken, exceeding the 1931 record four times over 9 days in August 2018 during an extended marine heat wave.
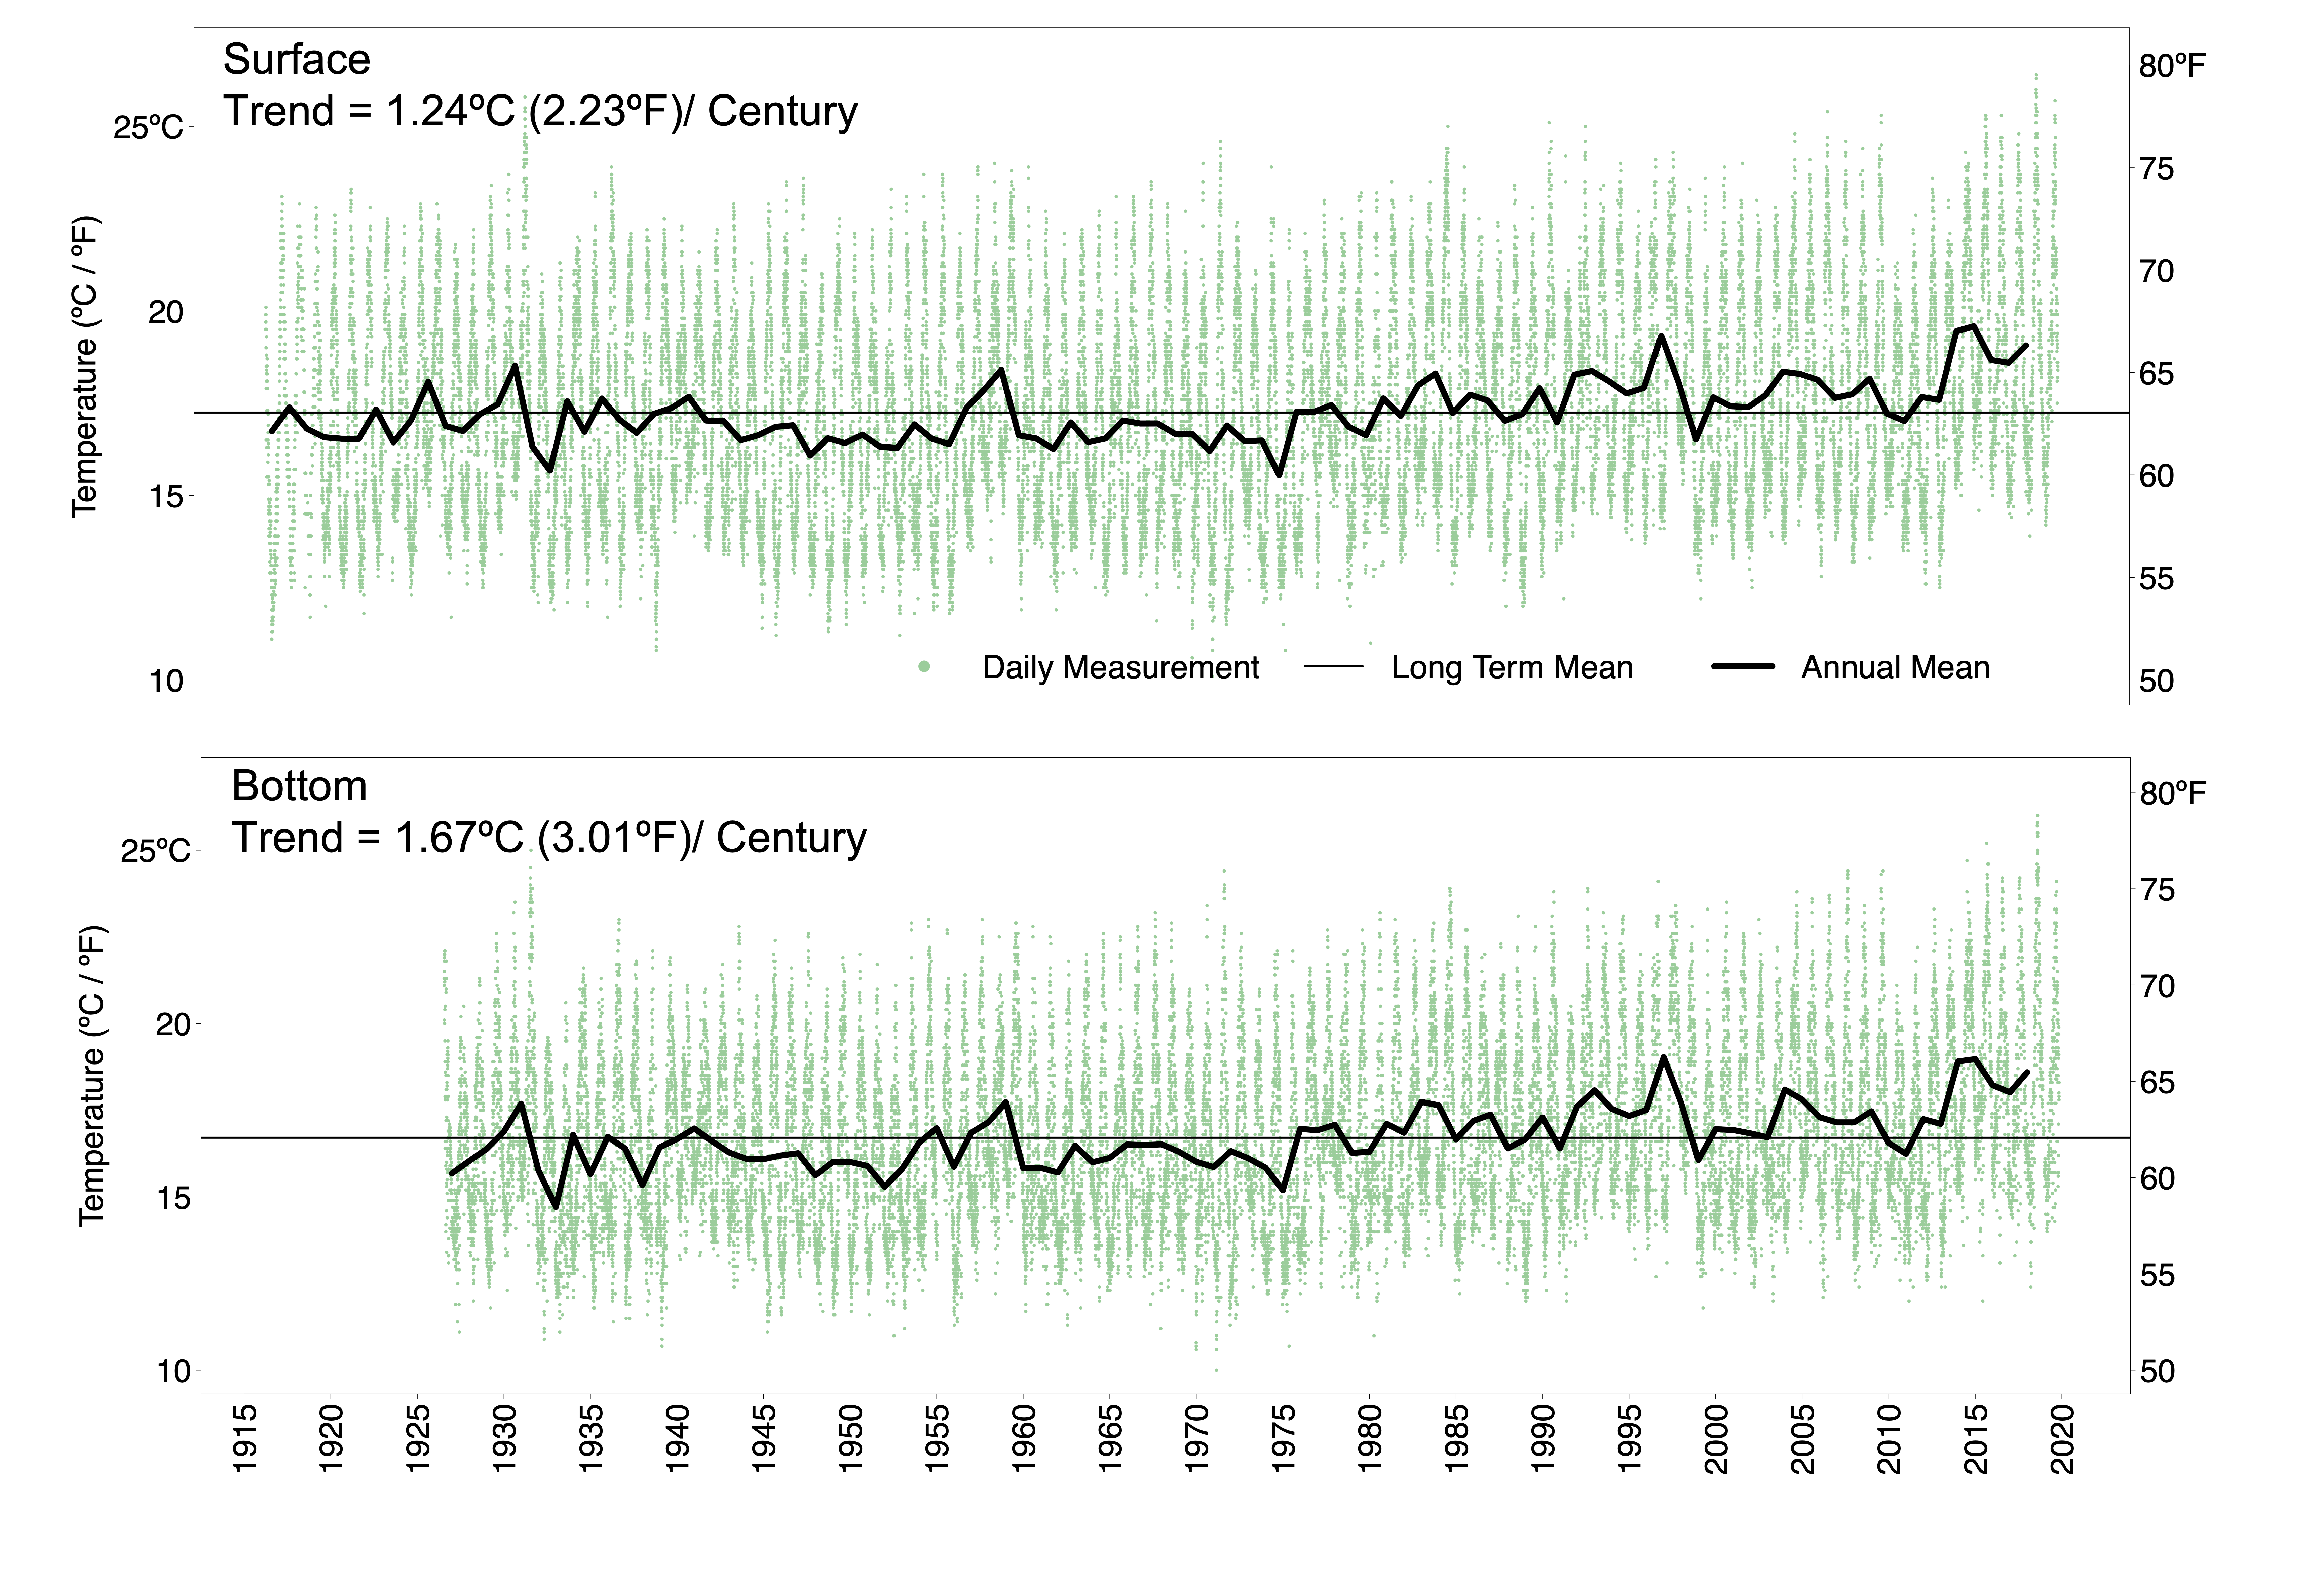
This program ranks as one of the world’s longest ocean time-series and the longest, continuous, ocean temperature record in the Pacific Ocean. From this time-series we can accurately pin down the nature of ocean seasonality for the entire coast of California, and have begun to understand the anomalies caused by recurring equatorial El Niño conditions. There have been large cold anomalies too, but, as yet, we do not understand their cause.
In addition to these episodic anomalies, there has been a long-term trend for a warmer California Current beginning around 1977. These warm and cold anomalies, and the long-term warming trend have significant biological effects on plankton production, fish catch and seabirds. They also are associated with changes in sea level, wave heights and beach erosion. We are only beginning to learn the details of the linkages between all these processes.
This growing databank provides us with one of the first opportunities to separate natural from anthropogenic changes in our coastal zone. These data consist of daily temperature and salinity values when available, and are updated quarterly throughout the year.
For more information about the Shore Stations Program and to access the data please visit: Shore Stations Program
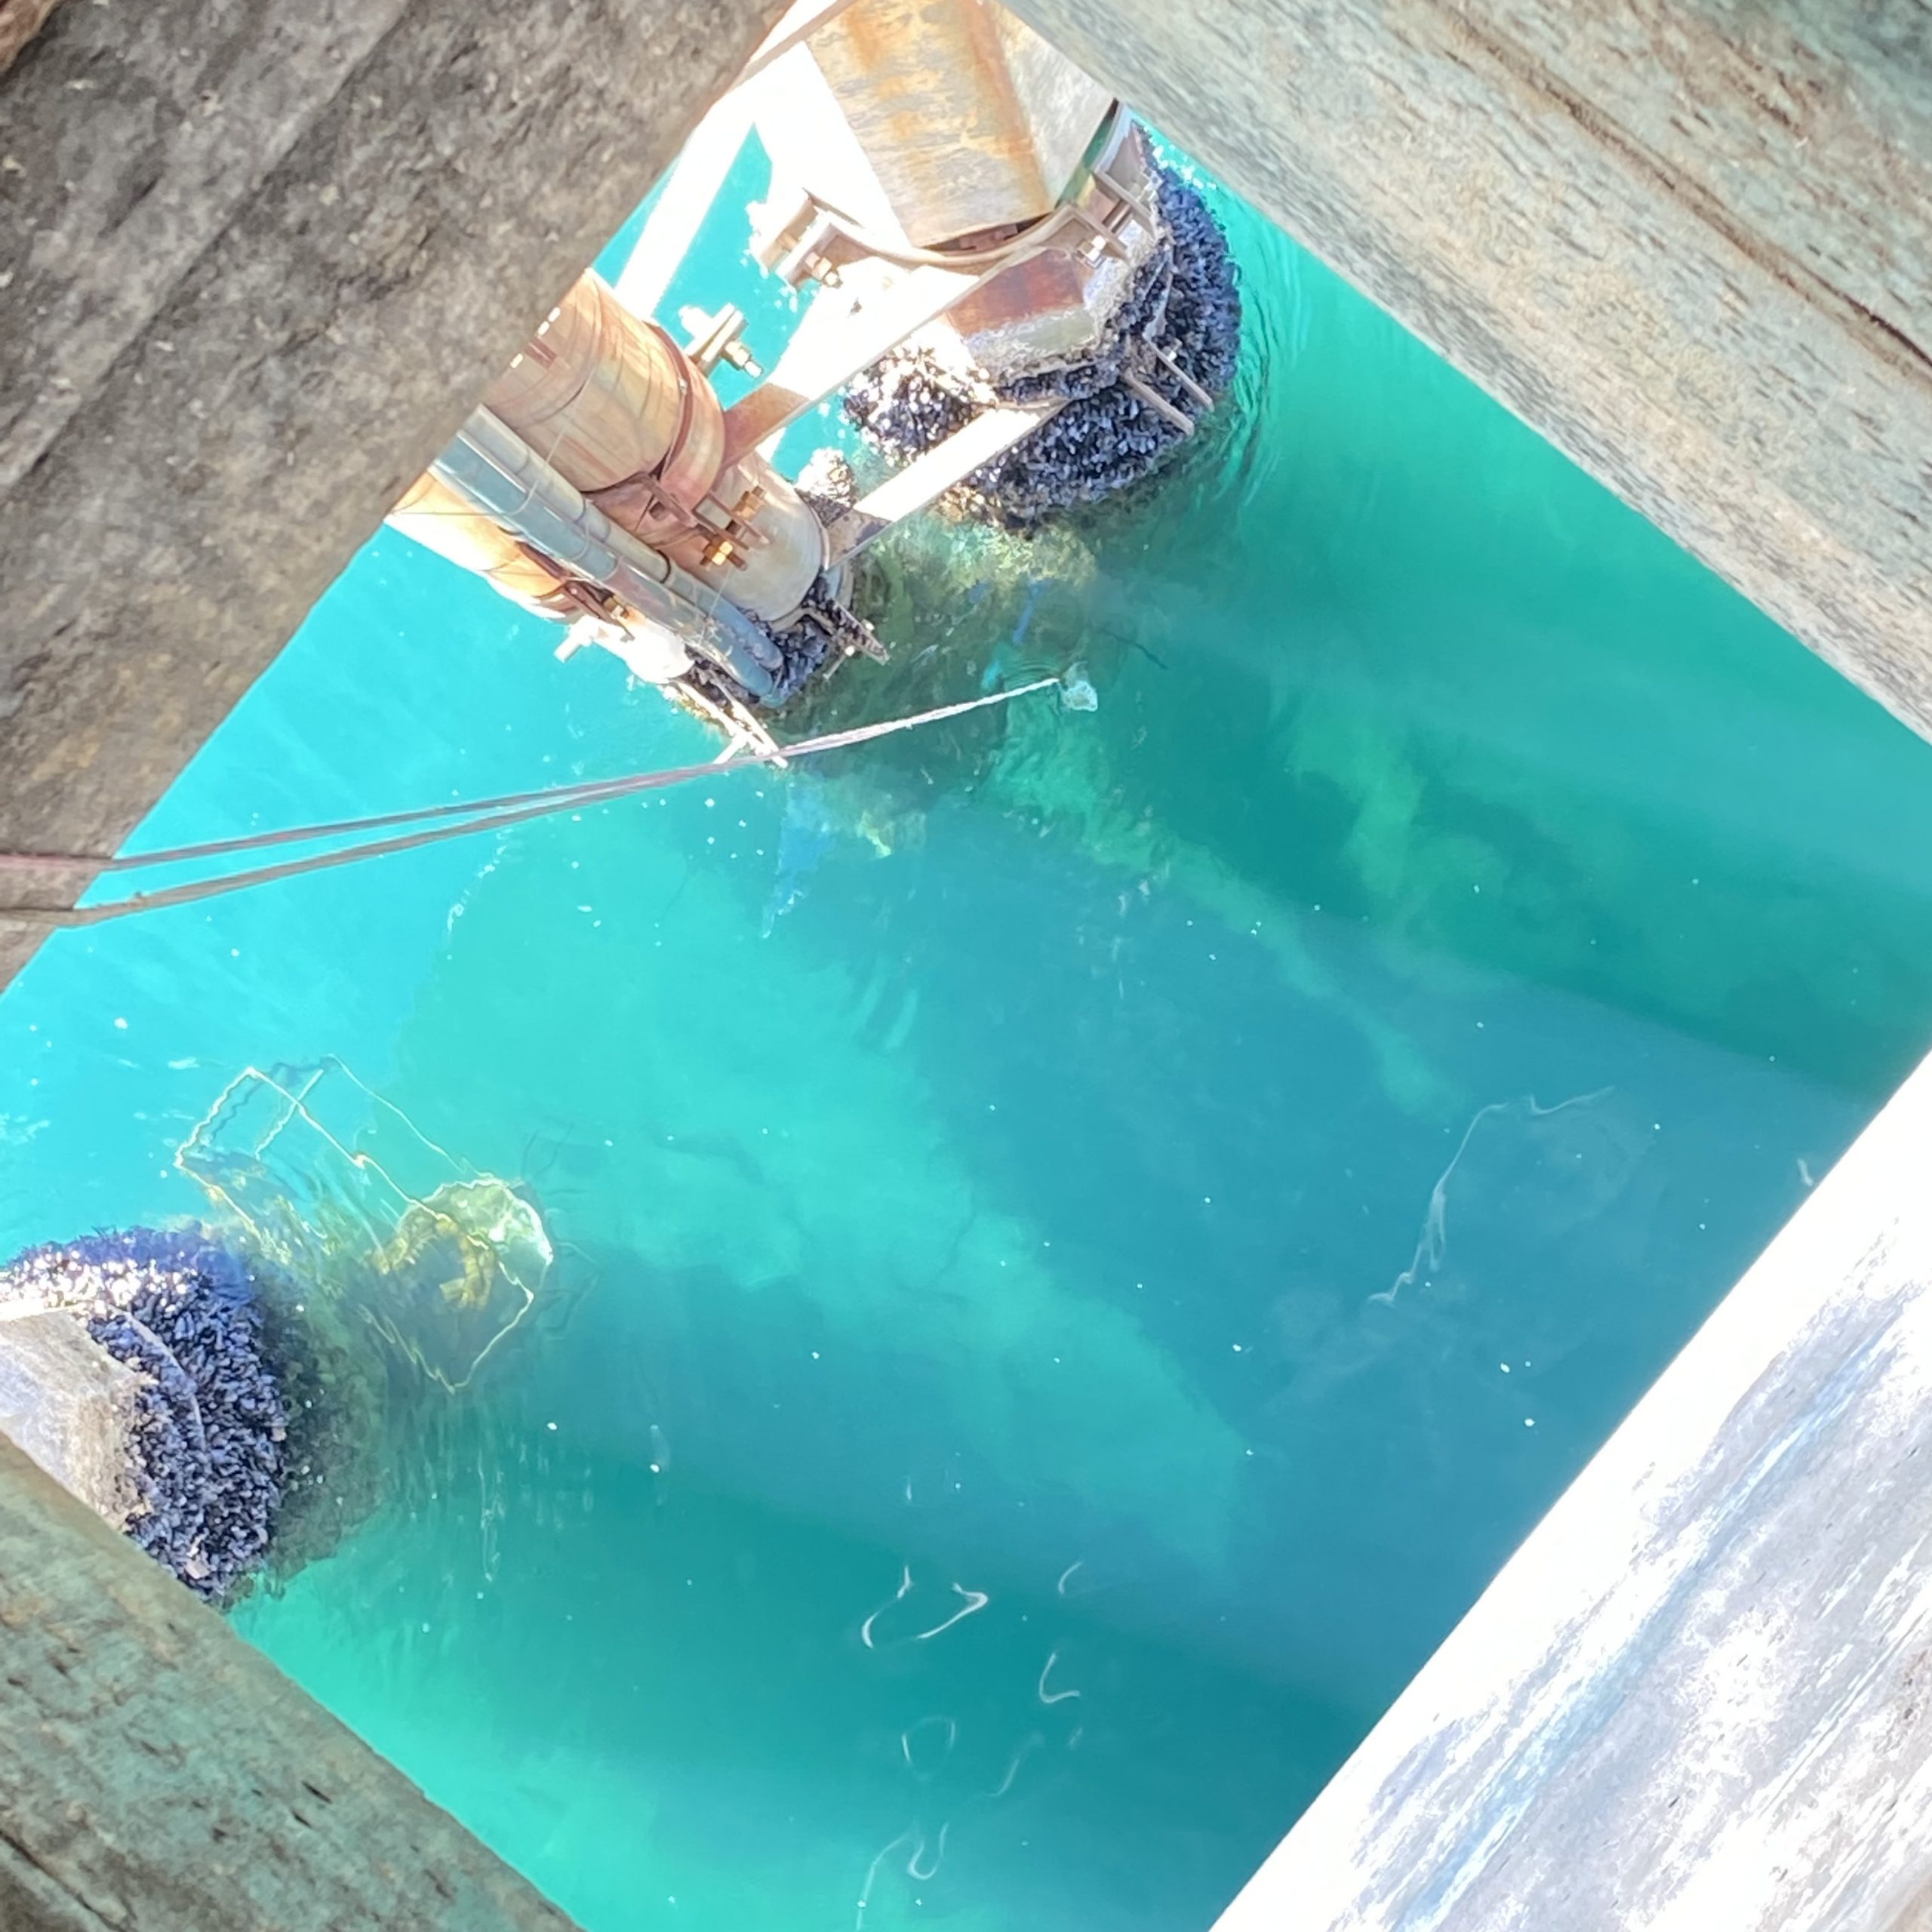
View down the sampling well
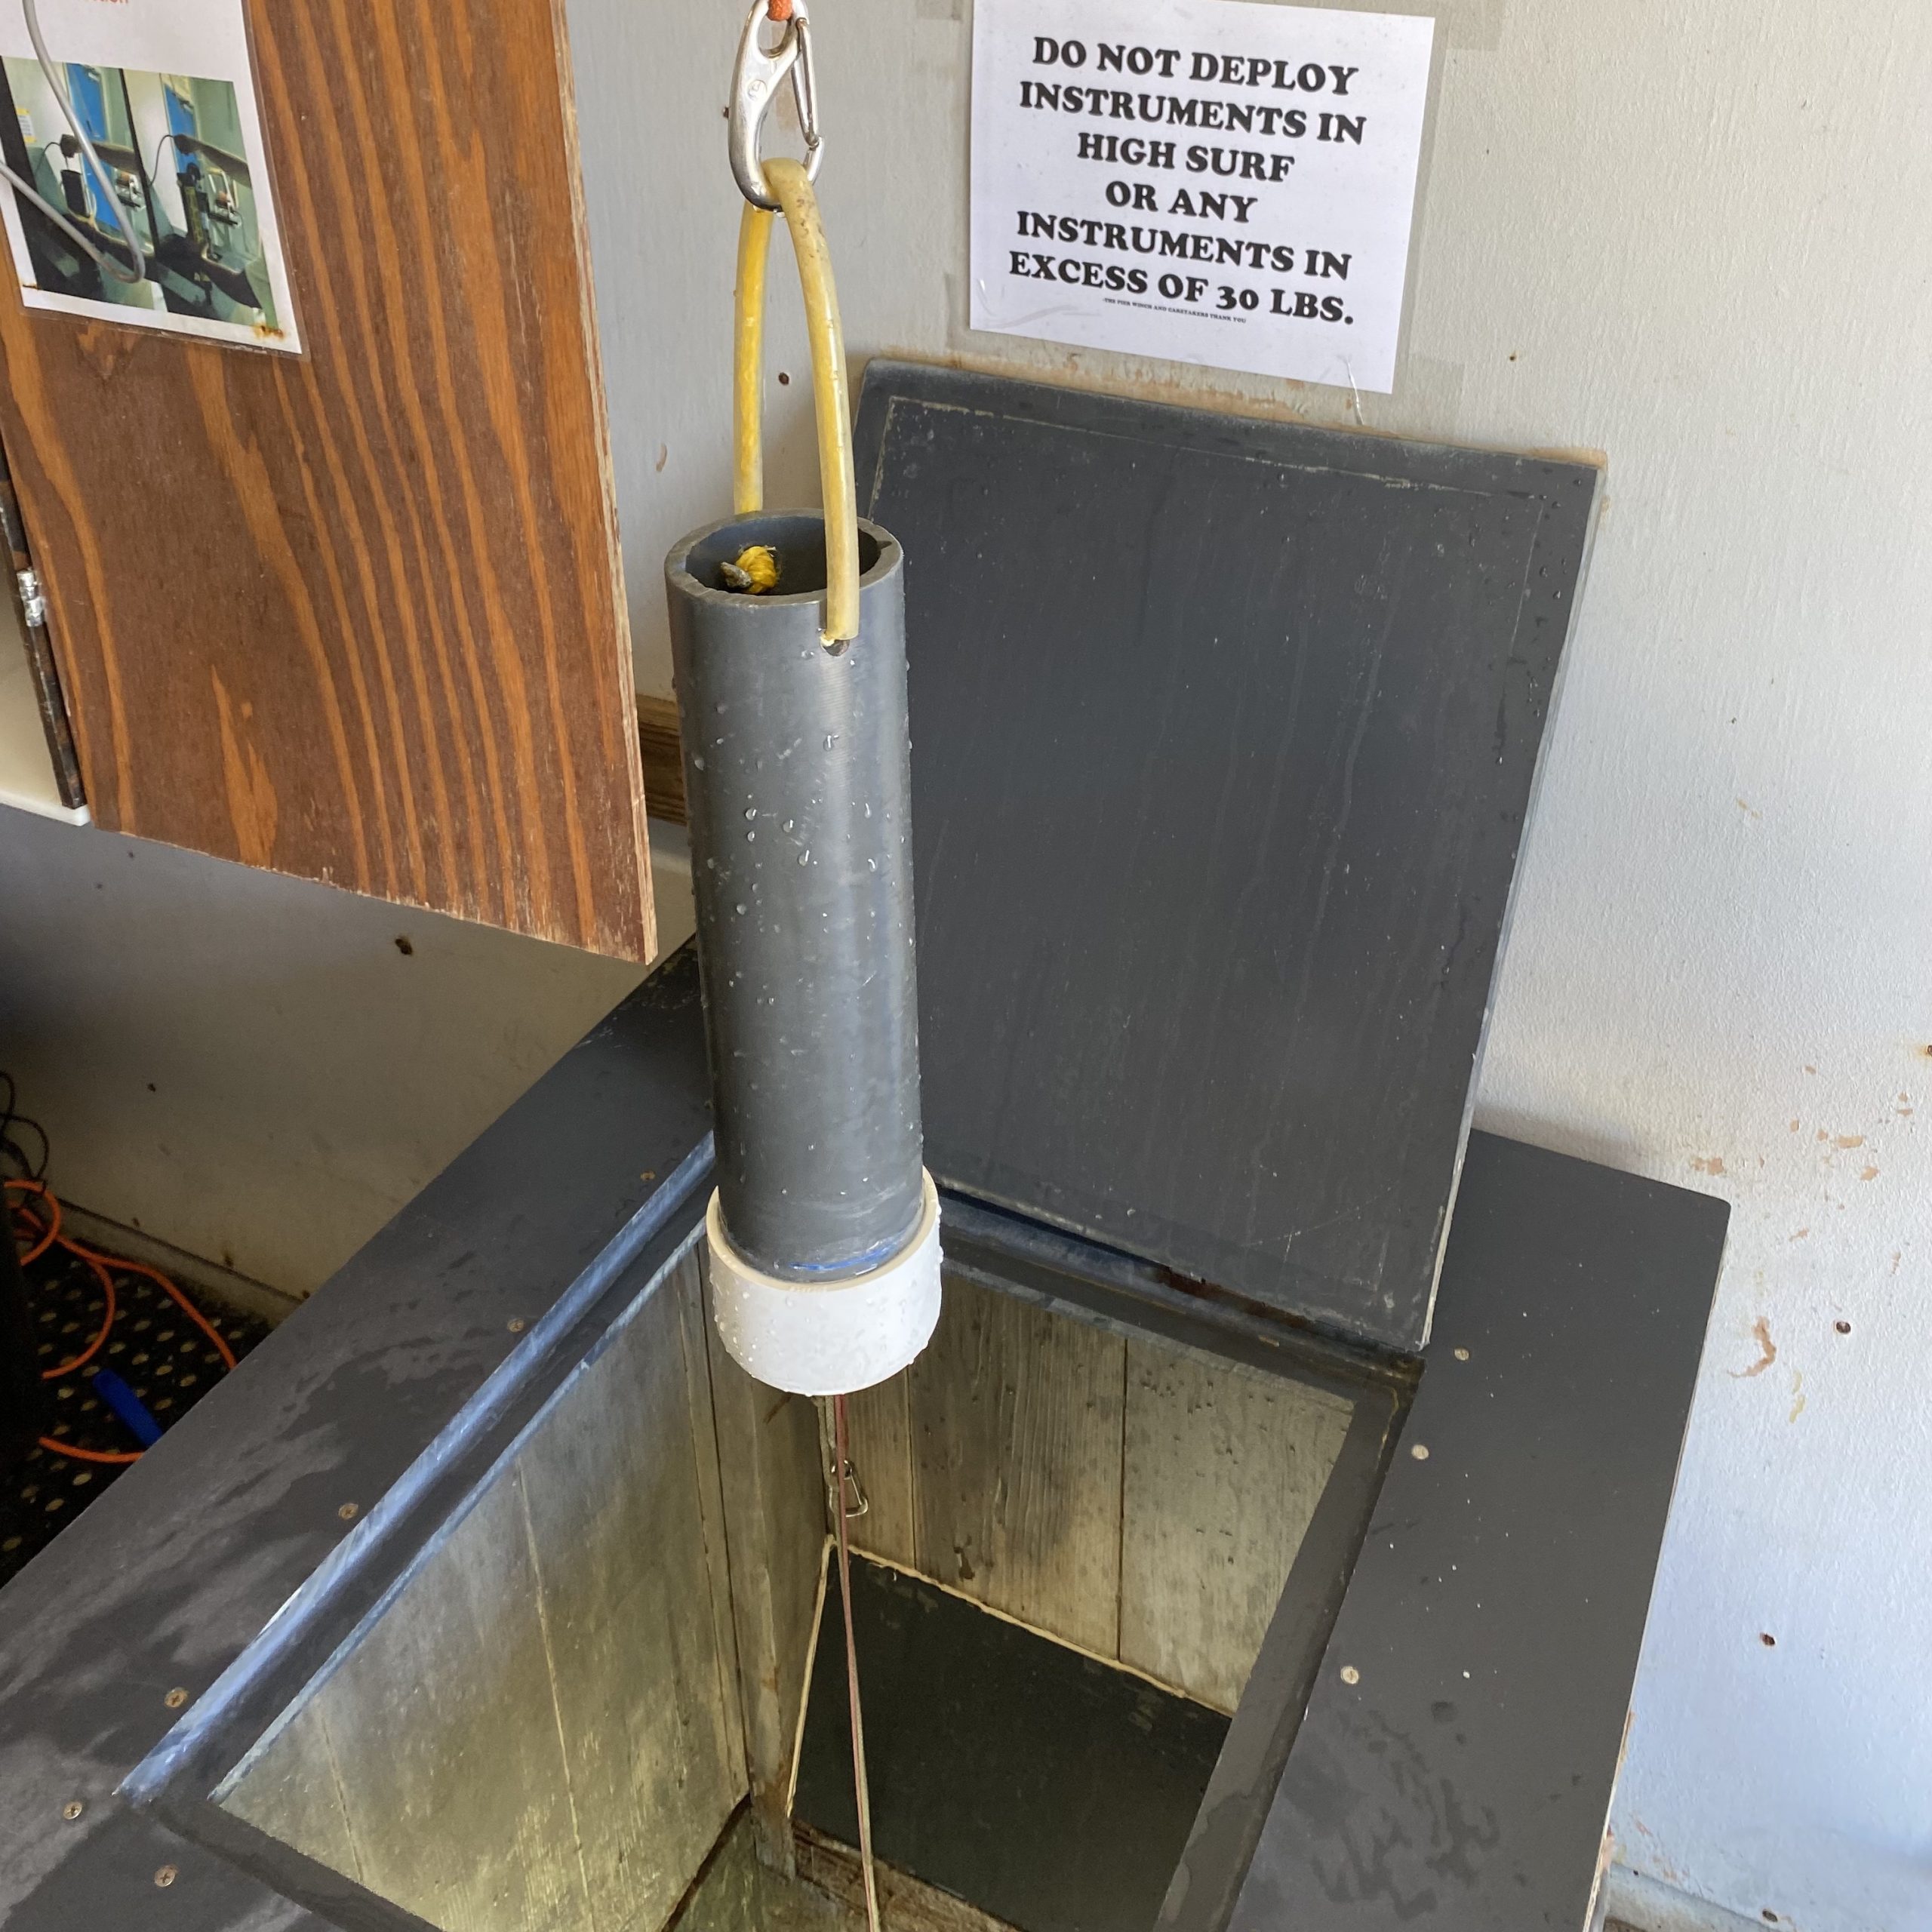
Bucket to collect surface seawater
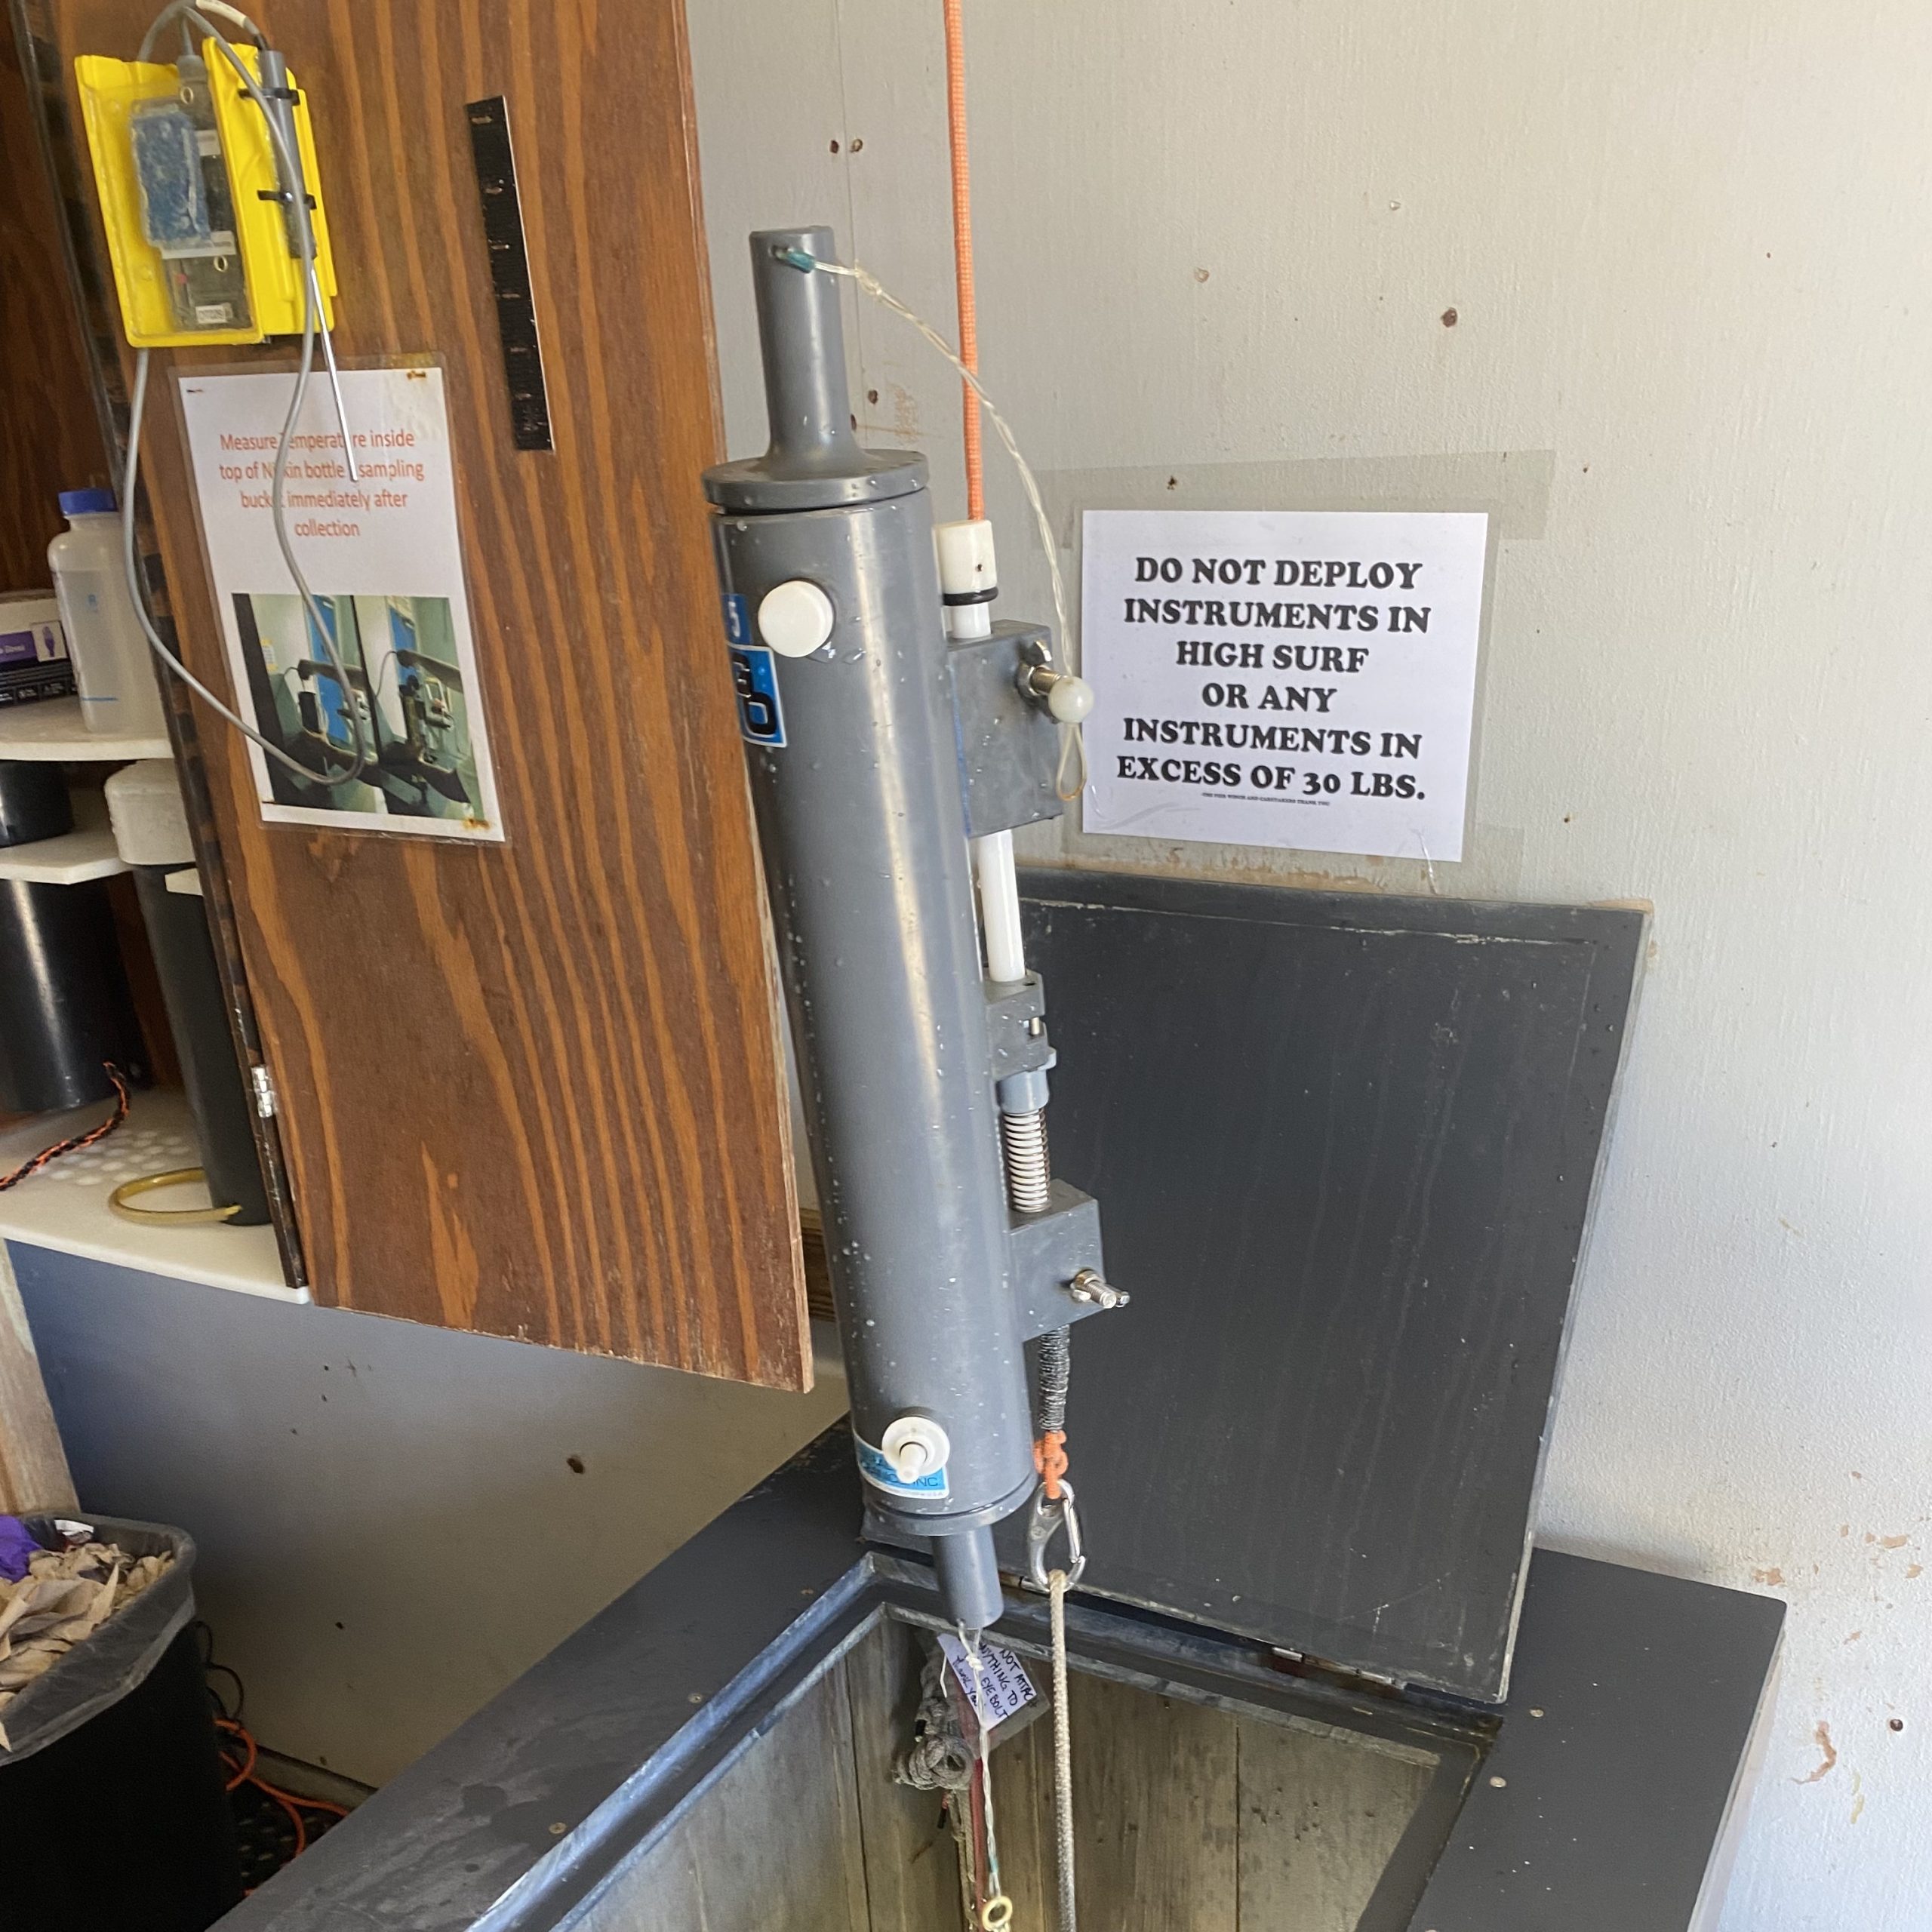
Niskin bottle to collect bottom seawater
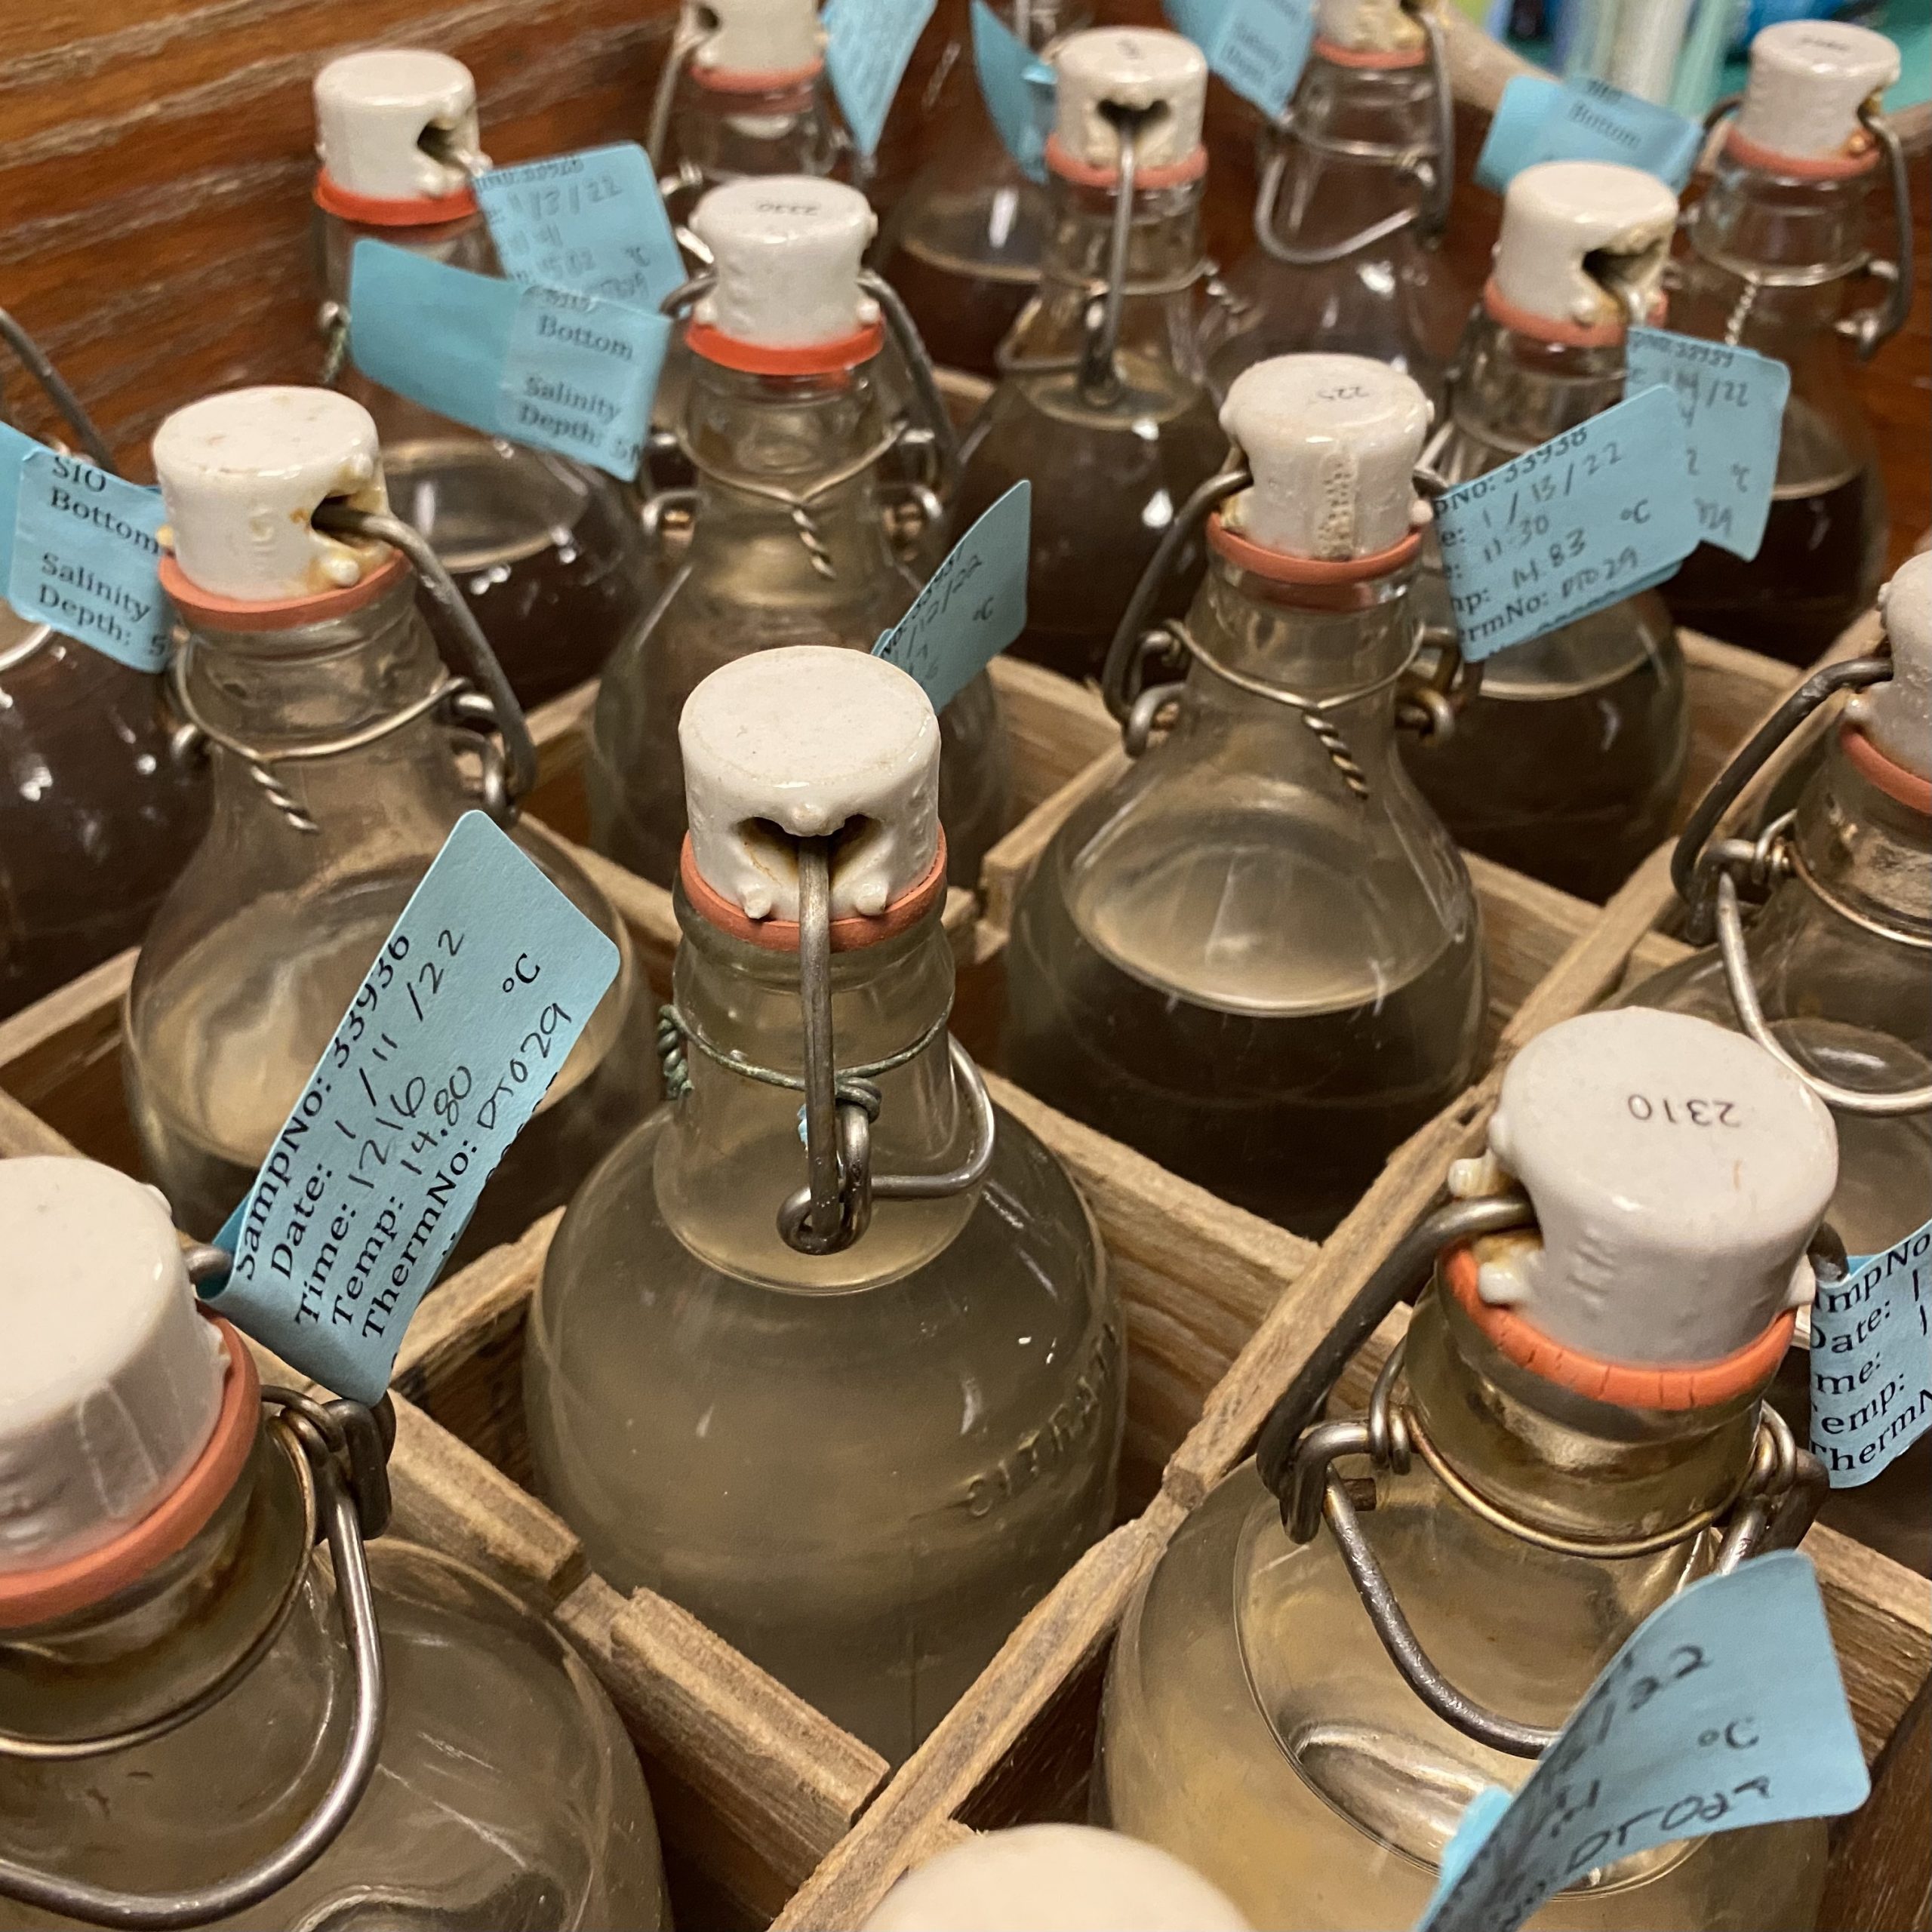
Bottled salinity samples to be processed